< Back to Projects

Hurricane Visualization using Illustration-inspired techniques

Alark Joshi, Jesus Caban, Penny Rheingans and Lynn Sparling


Abstract


The devastating power of hurricanes was evident during the 2005 hurricane season, the most active season on record. This has prompted increased efforts by researchers to understand the physical processes that underlie the genesis, intensification, and tracks of hurricanes. This research aims at facilitating an improved understanding into the structure of hurricanes with the aid of visualization techniques. Our approach was developed by a mixed team of visualization and domain experts. To better understand these systems, and to explore their representation in NWP models, we use a variety of illustration-inspired techniques to visualize their structure and time evolution. Illustration-inspired techniques aid in the identification of the amount of vertical wind shear in a hurricane, which can help meteorologists predict dissipation. Illustration-style visualization, in combination with standard visualization techniques, helped explore the vortex rollup phenomena and the mesovortices contained within. We evaluated the effectiveness of our visualization with the help of six hurricane experts. The expert evaluation showed that the illustration-inspired techniques were preferred over existing tools. Visualization of the evolution of structural features is a prelude to a deeper visual analysis of the underlying dynamics.

Paper

Case Study on Visualizing Hurricanes Using Illustration-Inspired Techniques, Alark Joshi, Jesus Caban, Penny Rheingans, Lynn Sparling, IEEE Transactions on Visualization and Computer Graphics, vol 15, no. 5, pp 709-718, Sept/Oct. 2009.

Images


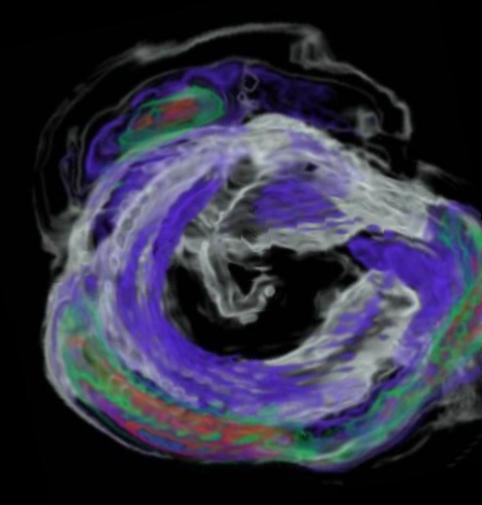
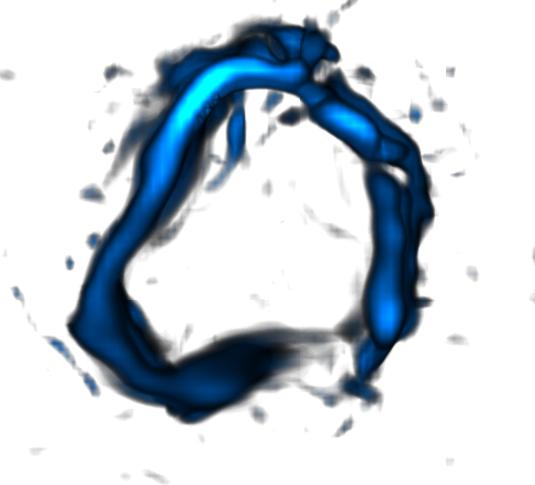
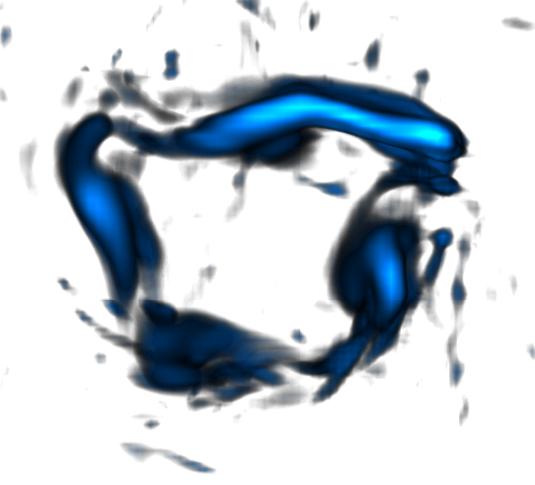
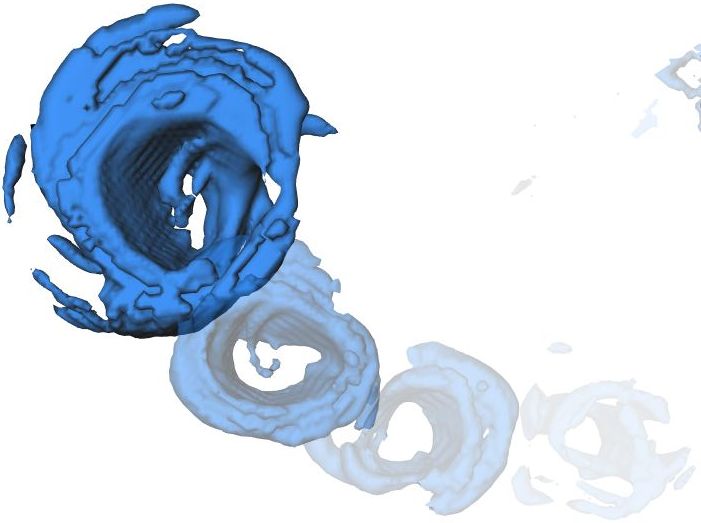
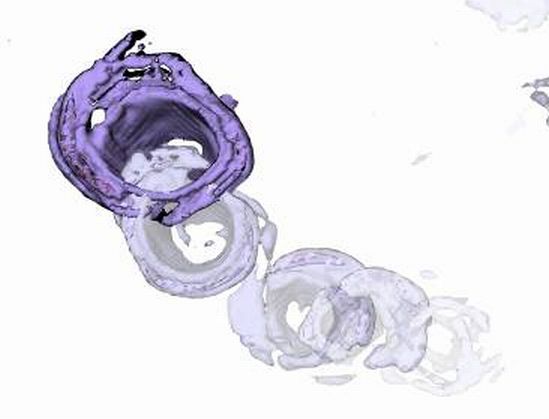
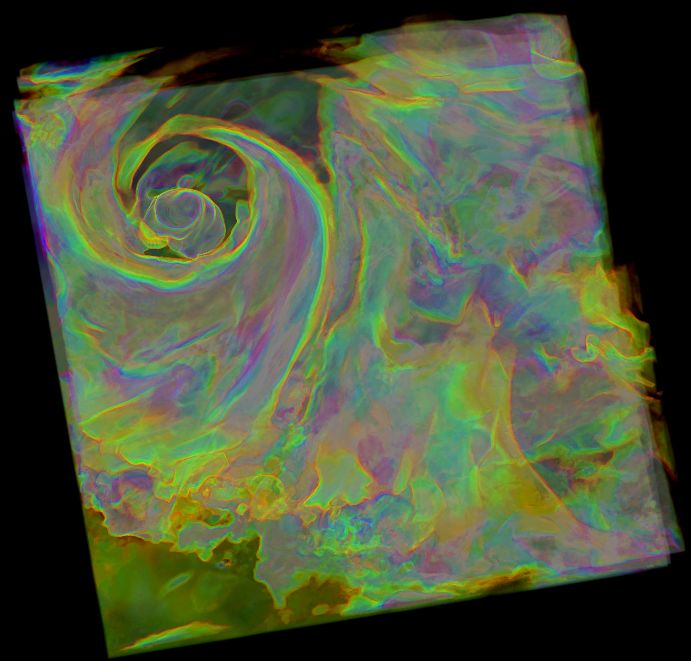
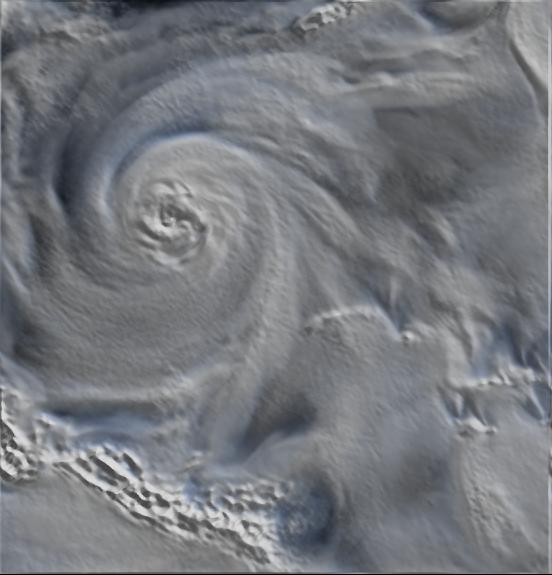
Original volume rendered image with lighting of the humidity attribute in Hurricane Katrina. The eye of the hurricane can be seen in the top left region of the image. The rainbands, which are spiral structures emanating from the eye too can be seen.

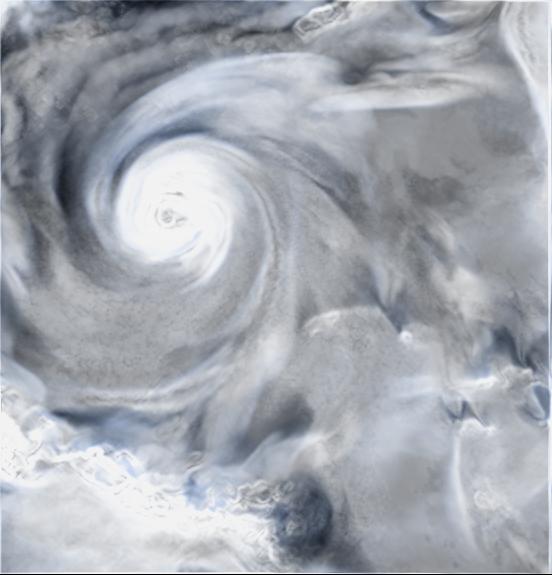
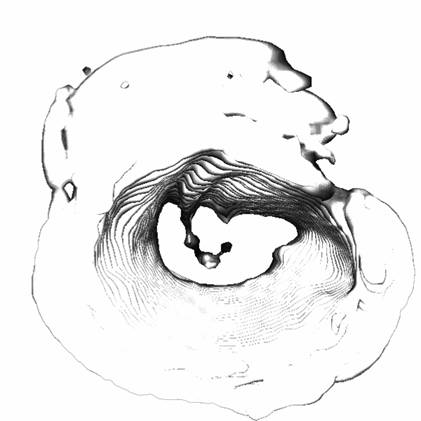
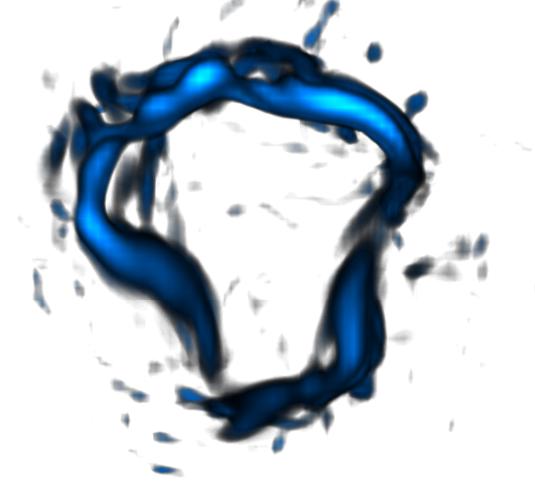
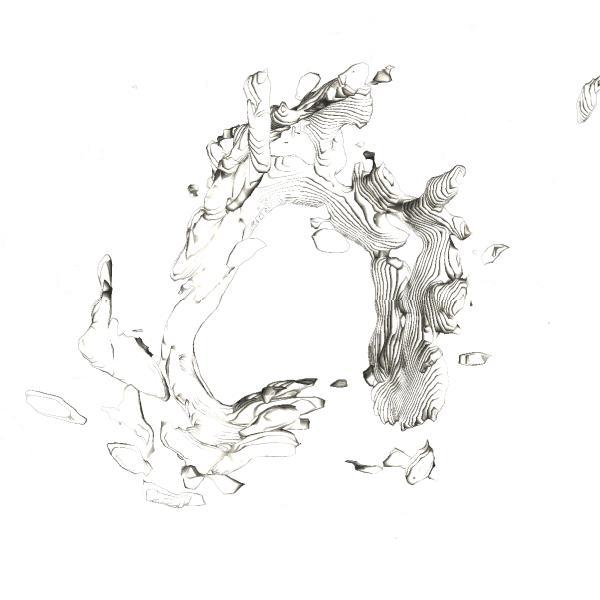
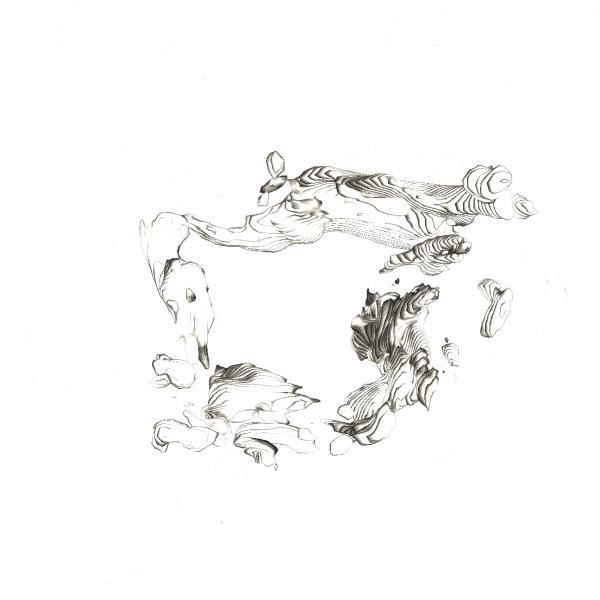
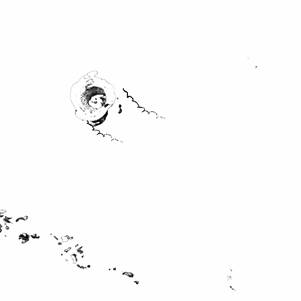
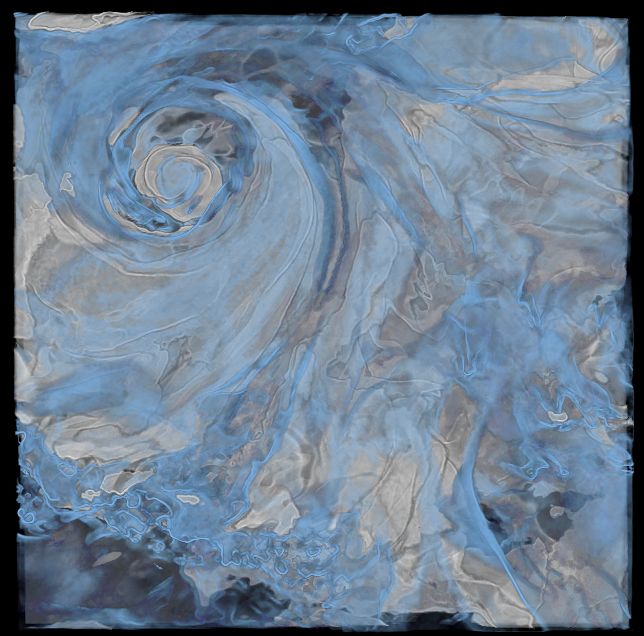
This image depicts a visualization generated using the boundary enhancement technique of the humidity attribute. In this image, the eyewall of the hurricane too is visible along with the eye. The eyewall is well-defined and implies that the hurricane is a category 4 hurricane in this timestep. The rainbands too are more well defined.

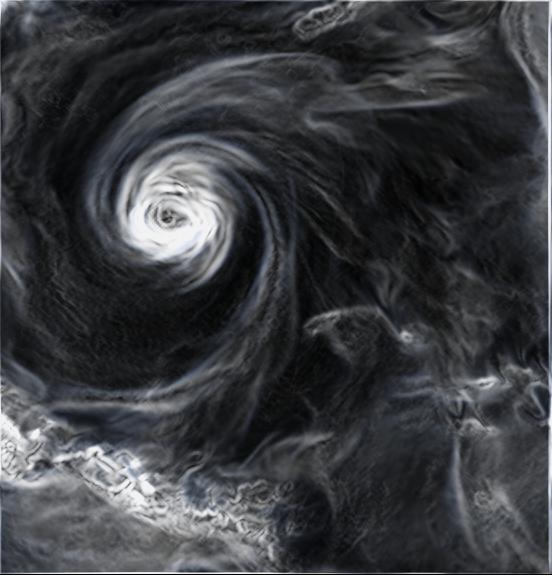
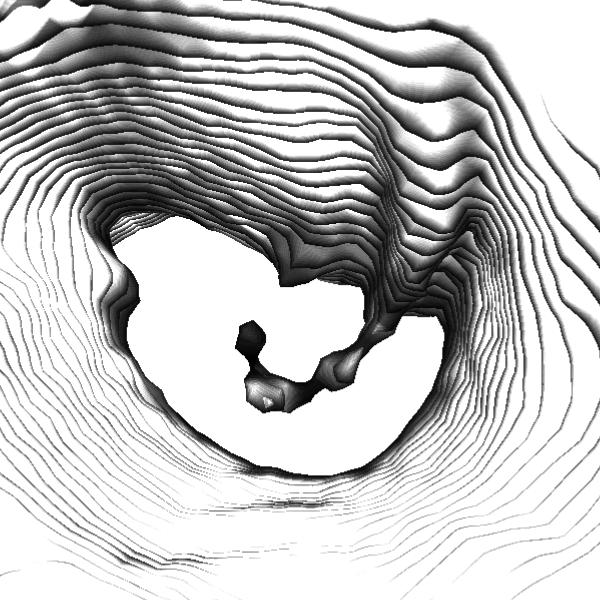
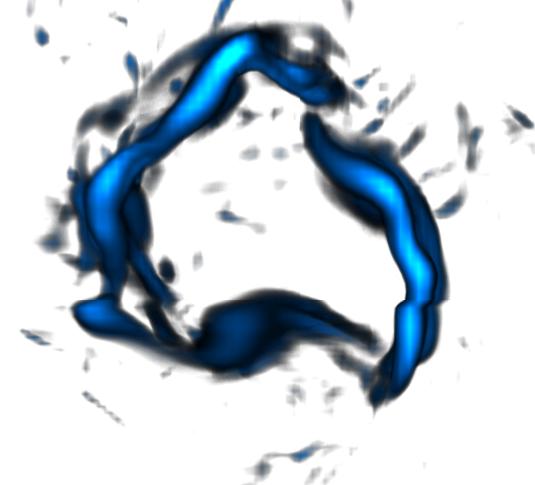
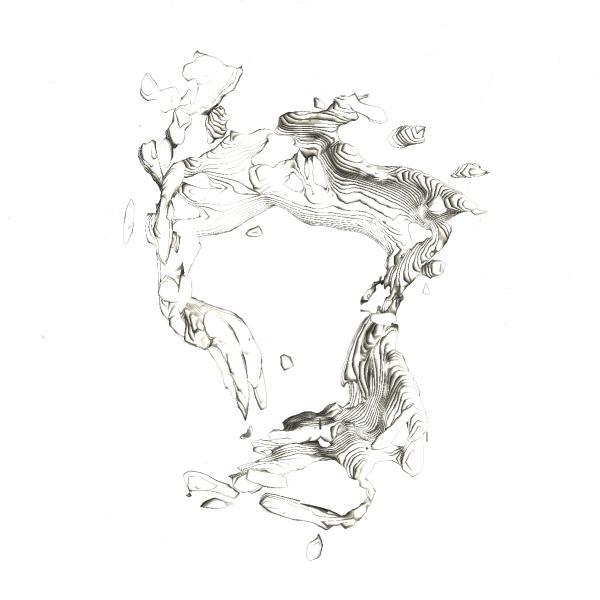
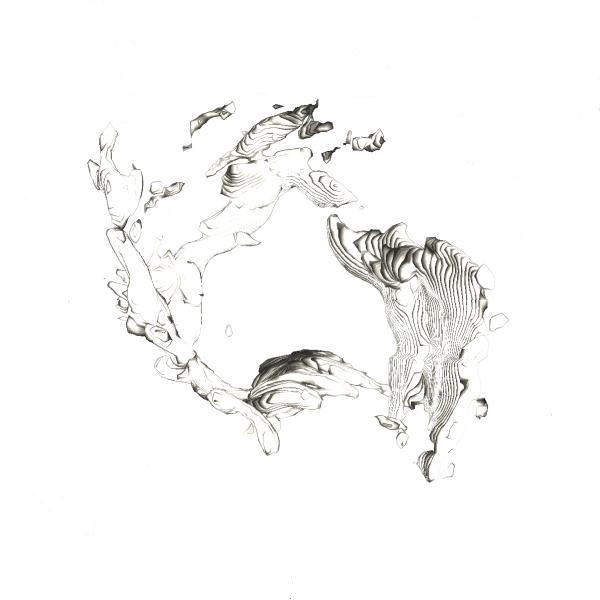
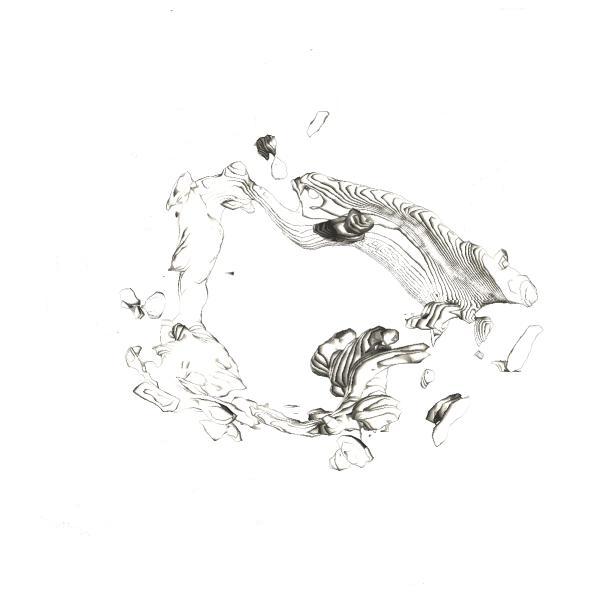
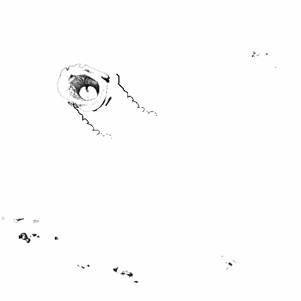
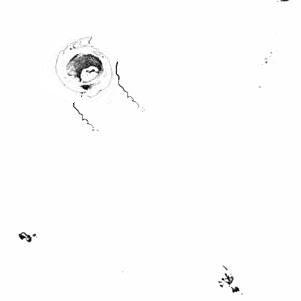
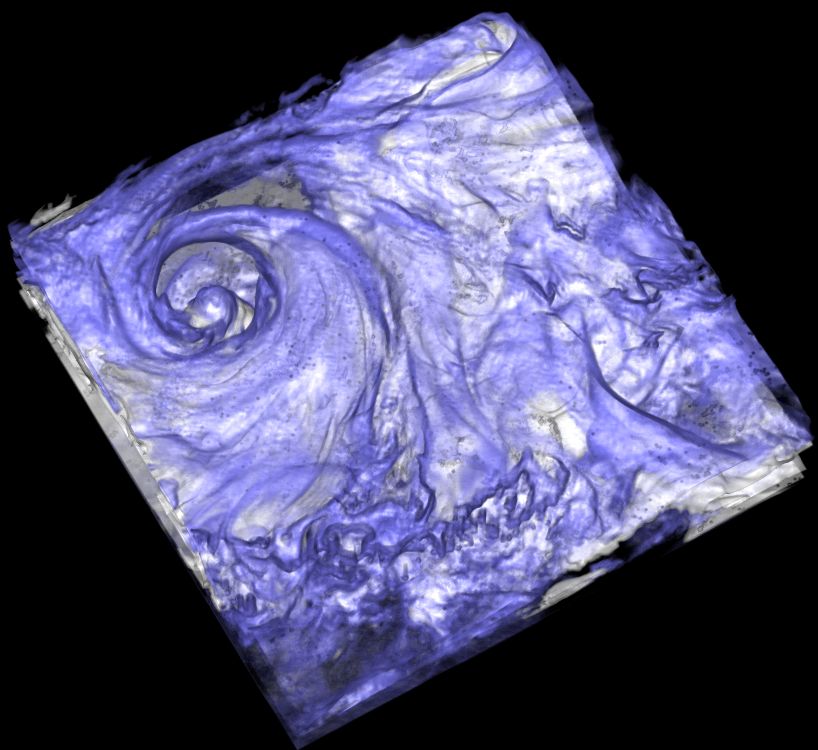
In this image a visualization generated using silhouette enhancement technique clearly shows the eye, the eyewall and the rainbands. These "interesting" features are preserved and accentuated while the other uninteresting regions are eliminated.

Volume rendering of the humidity attribute in the 71st timestep of hurricane Katrina.

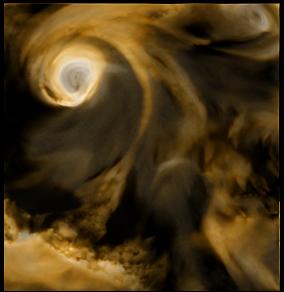
Boundary enhanced version.

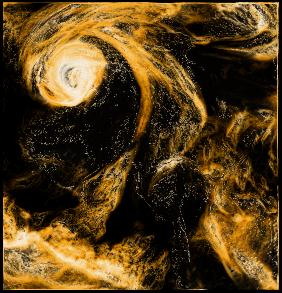
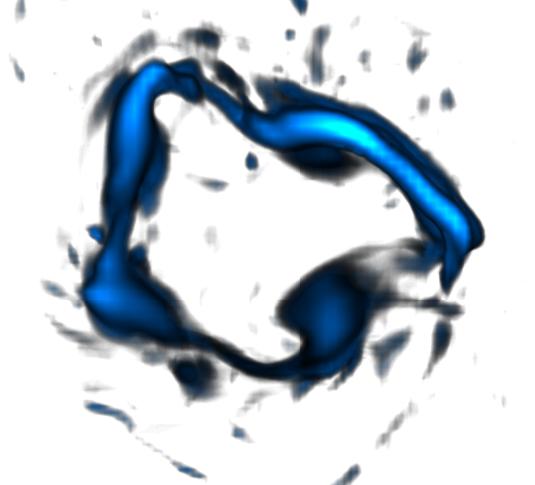
Boundary and Silhouette enhanced.


Visualizing the cloud water attribute in hurricane Katrina
Multidimensional transfer functions
Illustration-inspired visualization of the eye of a hurricane


Vorticity field in Hurricane Bonnie - Volume rendering (top row) compared to Illustration-inspired visualization (bottom row)
Timestep 13 Timestep 20 Timestep 26 Timestep 30 Timestep 33
Video of all the 120 timesteps of Vorticity - Volume Rendered
Illustrative visualization of Vorticity video


Conveying the time-varying nature of a hurricane

Opacity-based techniques conveying change in the hurricane over time. Hurricane footprints from timestep 10, 35, 53, 71 are shown here. Older timesteps are represented in a faded manner to provide context.

Speedlines and opacity based techniques are combined to produce an expressive visualization that conveys change over time. The evolution and growth of a hurricane can be conveyed through this image.


Visualization in which older faded footprints represent time instants when the hurricane changed its category.
Opacity-based visualization with a footprint for every instant that the hurricane changes its category
Video showing footprints of timesteps when the hurricane changes its category


Hurricane Katrina - Cloud water visualization annotated with speedlines

Timestep 52

Timestep 58

Timestep 64

Timestep 71


Humidity visualization of timestep 71 in hurricane Katrina
Isosurface visualization of cloud water. Two-level rendering with Isosurface and volume rendering of cloud water. Volume Rendering with lighting turned on.