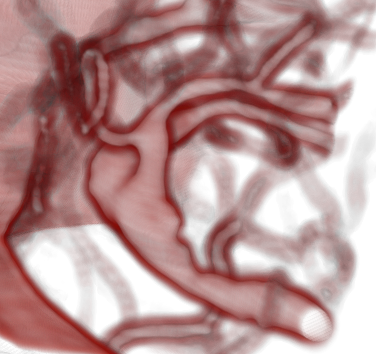
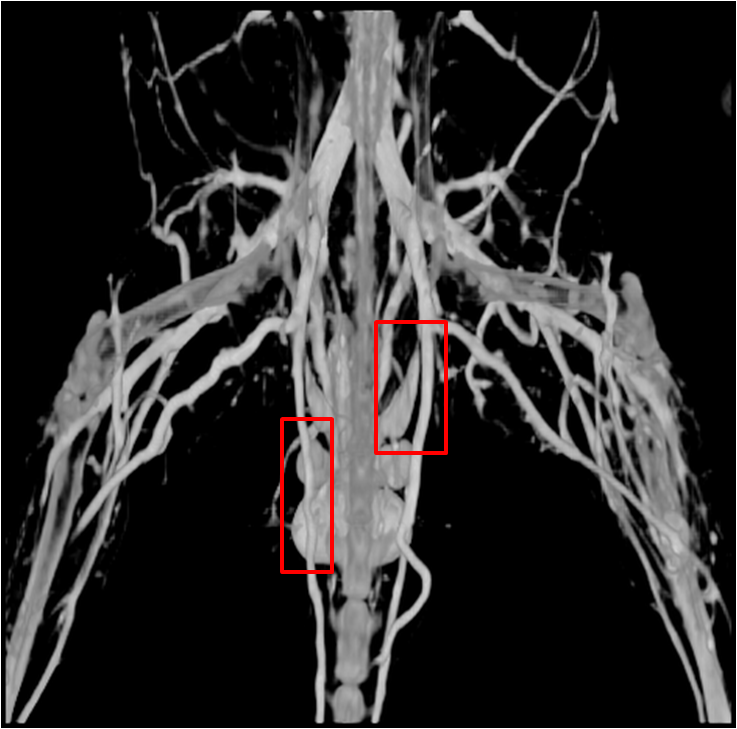
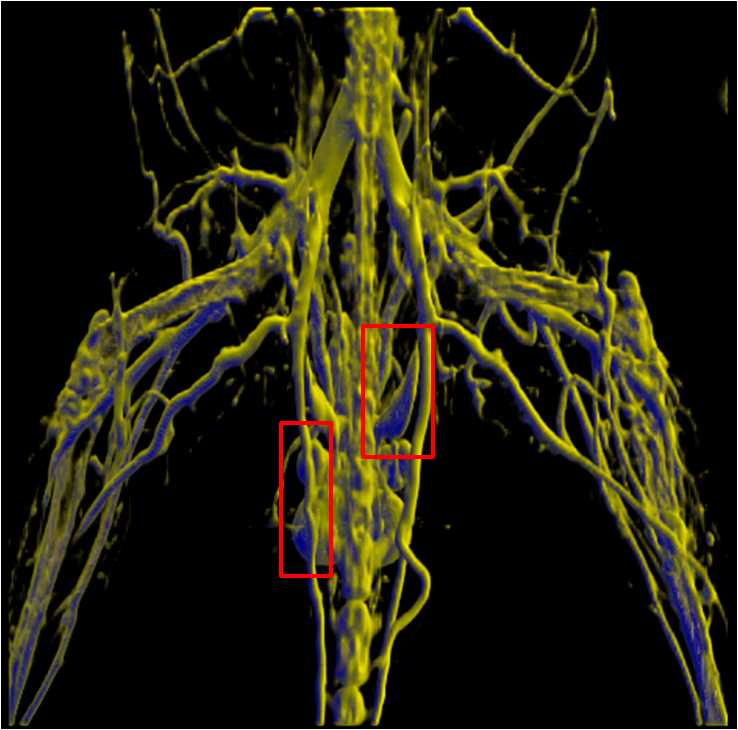
The effective visualization of vascular structures is critical for diagnosis, surgical planning as well as treatment evaluation.
In recent work, we have developed an algorithm for vessel detection that examines the intensity profile around each voxel in an
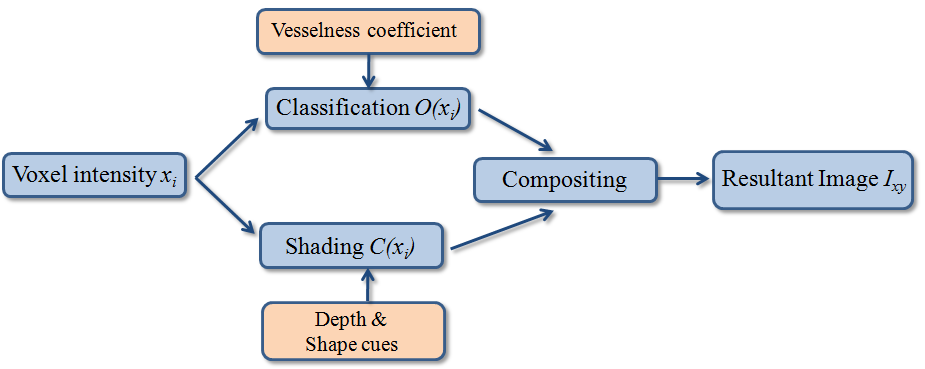
angiographic image and determines the likelihood that any given voxel belongs to a vessel; we term this the “vesselness coefficient”
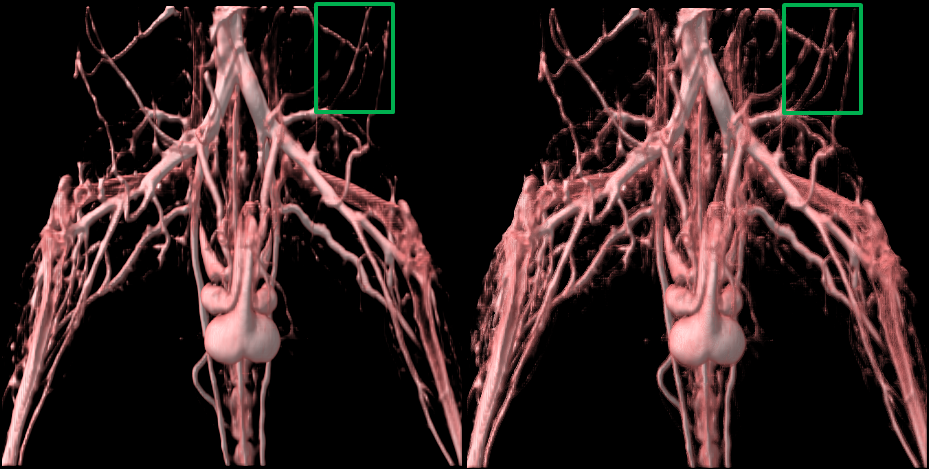
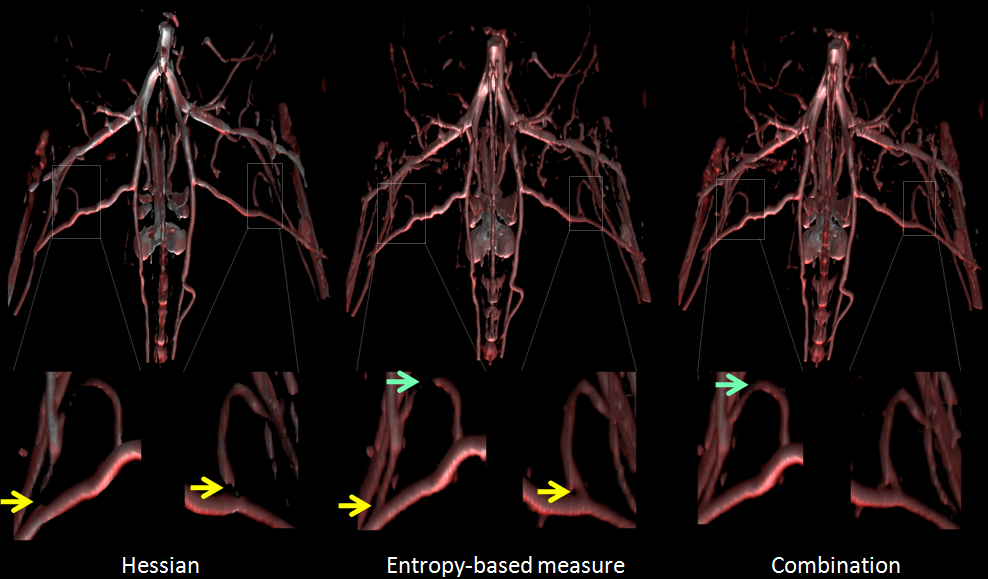
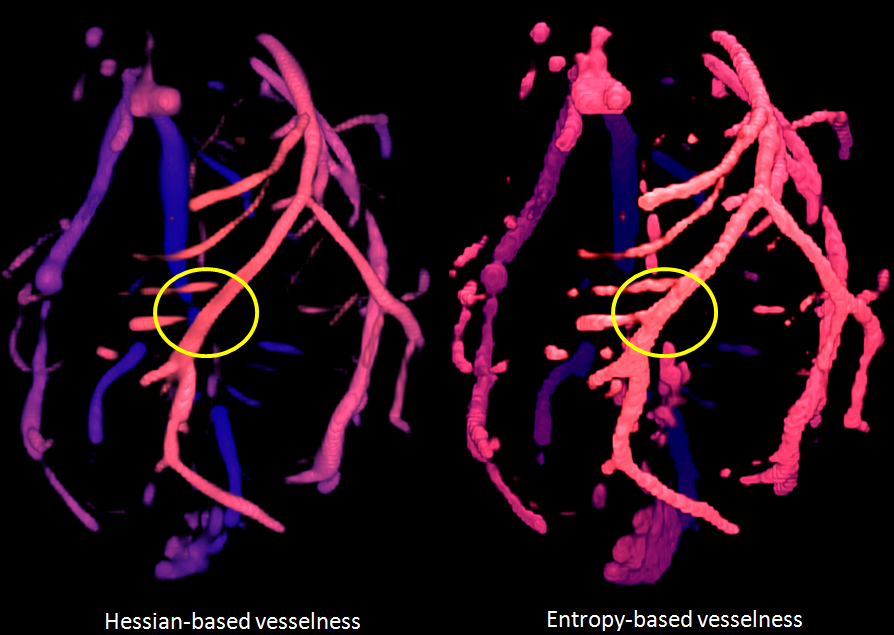
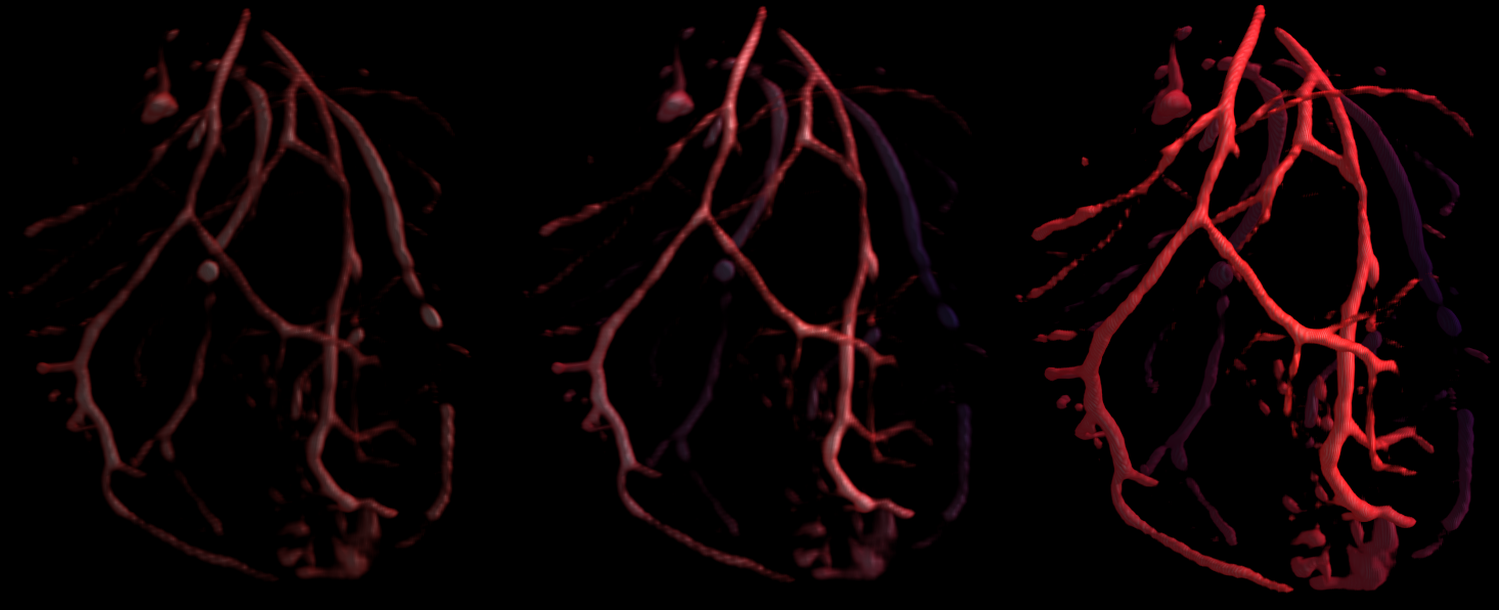
of the voxel. Our results show that our algorithm works particularly well for visualizing branch points in vessels. Compared to
standard Hessian based techniques, which are fine-tuned to identify long cylindrical structures, our technique identifies branches and
connections with other vessels.
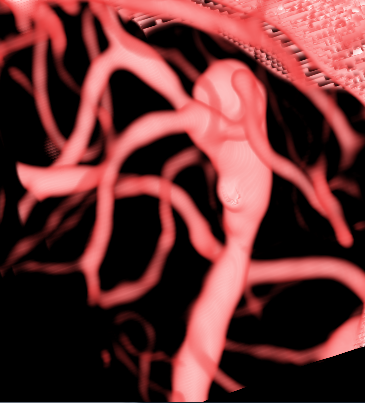
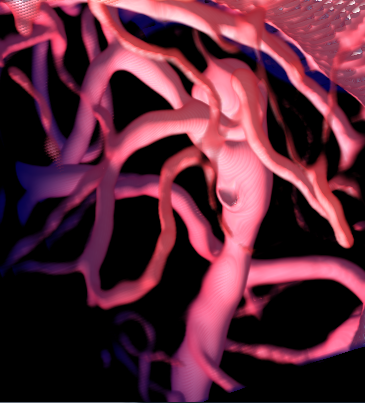
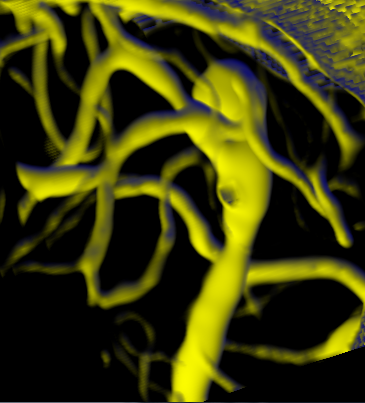
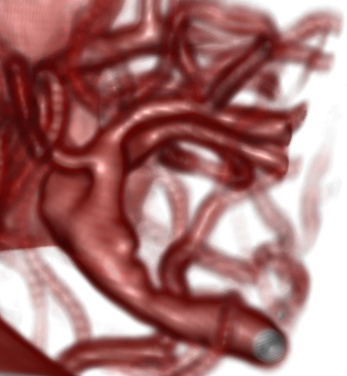
Using our computed vesselness coefficient, we explore a set of techniques for visualizing vasculature. Visualizing vessels is particularly
challenging because not only is their position in space important for clinicians but it is also important to be able to resolve
their spatial relationship. We applied visualization techniques that provide shape cues as well as depth cues to allow the viewer to
differentiate between vessels that are closer from those that are farther. We use our computed vesselness coefficient to effectively
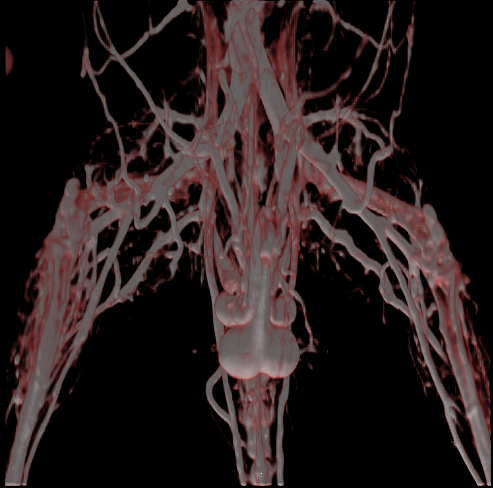
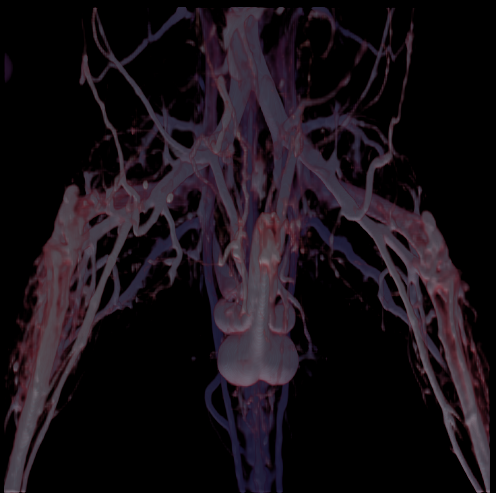
visualize vasculature in both clinical neurovascular x-ray computed tomography based angiography images, as well as images from
three different animal studies. We conducted a formal user evaluation of our visualization techniques with the help of radiologists,
surgeons, and other expert users. Results indicate that experts preferred distance color blending and tone shading for conveying
depth over standard visualization techniques.