Project 1: System Report
Project Repo Creation Link: https://classroom.github.com/a/LKYxhOIA
For our first project, we’ll implement a Unix utility called sysreport that inspects the system it runs on and creates a summarized report for the user. It will be loosely inspired by utilities such as top or Neofetch. To give you an idea of how your program will work, here’s a screenshot:
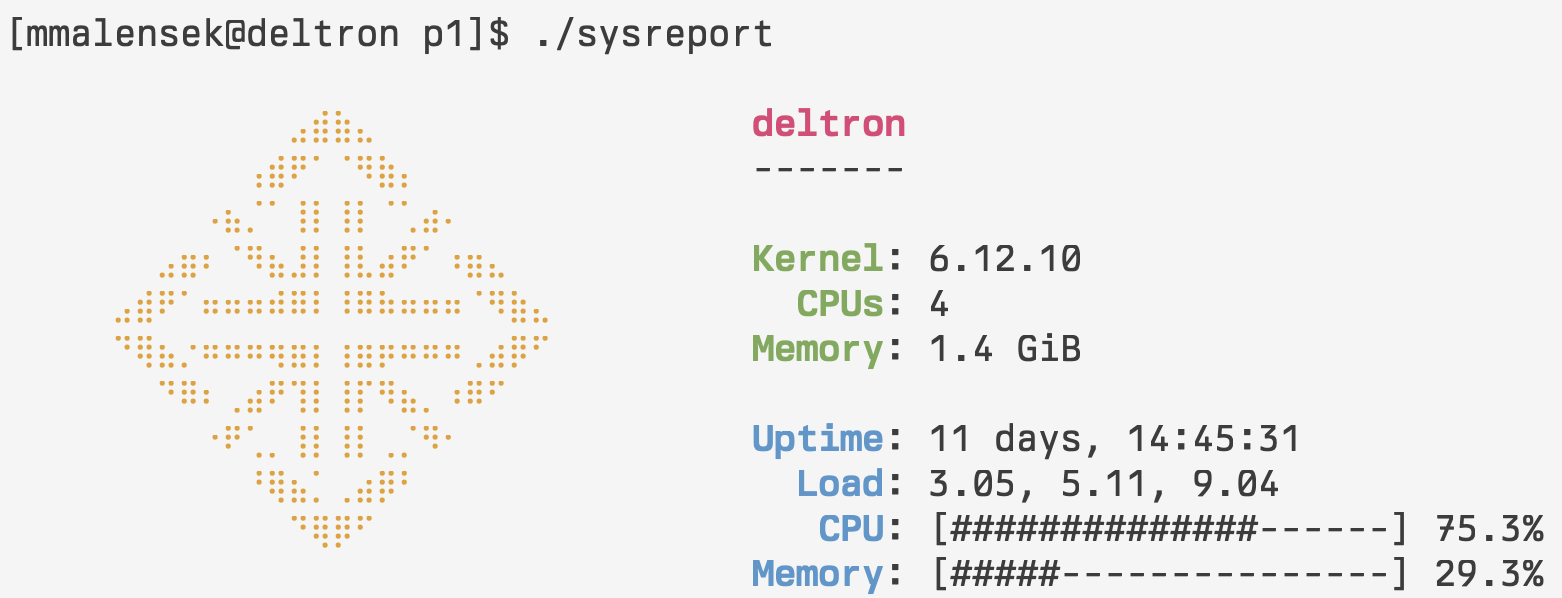
The hostname, kernel version, number of CPUs, and memory are static information, while the uptime, load average, CPU usage, and memory usage receive live updates as long as the program runs (by default, updating every second).
To get this information, you will use the proc, the process information pseudo-filesystem. While there are other ways to get the information displayed above, you are restricted to using proc in this assignment. There are two great resources for finding out what information is available in proc:
- Simply
cd /procin your shell and then runlsto view the files. You’ll see process IDs and several other virtual files that are updated dynamically with system information. Each line shown above in the process listing corresponds to a numbered directory in/proc. - Check out the man page:
man procfs. (If this doesn’t work, you probably need to install the man pages:pacman -Sy man-pages). The manual has a complete description of every file and directory stored under/proc, split into sections prefixed withproc_. For instance,man proc_uptimeexplains the/proc/uptimefile.
For a quick example of how files in procfs work, try running cat /proc/uptime. You’ll see the number of seconds the system has been running printed to the terminal.
In this assignment, you will get experience working with:
- The
open(),read(), andclose()system calls for reading file data - Tokenizing text files manually using C strings
- Argument parsing with
getopt - Load averages, calculating CPU usage, and Linux tasks
- Text-based UIs
The program will support a few command line options. We’ll let the program do the talking by printing usage information (-h option):
[magical-unicorn:~]$ ./sysreport -h
Usage: ./sysreport [-ho] [-i interval] [-p procfs_dir]

Options:
    * -h              Display help/usage information
    * -i interval     Set the update interval (default: 1000ms)
    * -p procfs_dir   Set the expected procfs mount point (default: /proc)
    * -o              Operate in one-shot mode (no live updates)
Pay particular attention to the -p flag. This allows us to change the directory where proc is mounted (/proc by default). We will use this option to test your code with our own pre-populated copy of proc.
Populating the Output
Your main responsibility in this project is implementing a variety of procfs-related functions to retrieve the required information. Here is a header file that describes each function and data structure you will support. Note that following these function signatures is required, unless permission is granted to do otherwise!
Here’s some tips to guide your implementation.
Hostname, Kernel Version, CPUs, Load Average
These should be straightforward to locate and extract the data with minimal post-processing. This part of the assignment is mostly a scavenger hunt!
Uptime
Format uptime as D day[s], HH:MM:SS. If the machine has been running for 1 day, do not print the ’s' in ‘days.’ If the machine has been running for less than 1 day, only print the hours, minutes, and seconds of uptime.
Memory
There are two parts to the memory being reported by our utility: the total system memory (RAM), and the current memory usage. You should use the total and available memory when reporting memory usage. (Usage is total - available).
Notice that the sizes reported here are in user-friendly units instead of raw kB. You should implement a function to do this:
void human_readable_sz(unsigned long num_bytes, unsigned short decimal_places,
        char *buf, size_t buf_sz);
In the screenshot above, decimal_places was set to 1 (one number after the decimal place).
Overall CPU Usage
CPU usage is calculated by sampling over a period of time, i.e., the CPU was active for 70% of one second. You will record the CPU usage, sleep for one second, and then get a second reading to determine the usage percentage. The CPU metrics in /proc/stat will add up to 100% because idle time is included. You’ll need to track idle time separately, so the calculation will look something like:
(usage2 - usage1) / (total2 - total1)
Where usage1 and total1 are from the first sample and usage2 and total2 are from the second sample. You’re effectively calculating the change in these two samples to get a usage percentage.
If the CPU usage percentage is NaN (not a number), or you encounter errors performing the calculation, report 0%. Since this calculation requires two samples, your function should take the previous sample as one of its arguments.
The UI
You can design the user interface however you’d like – the screenshot above is only an example. As long as you include all the required information, you can present it in any way you think looks best. Here is an example that you can use for inspiration.
Extra Feature
After implementing the baseline functionality, you’ll need to come up with a unique feature to add to your sysreport utility. The complexity of the feature should be roughly in line with the rest of the elements you implemented in the assignment. In the screenshot above, the student chose to implement a USF-inspired ASCII art printout and used escape sequences to colorize the output. You could choose to include some other feature, like an additional system metric, style the output in interesting ways, make animations, etc. If you have any doubts about whether your extra feature will count, consult the course staff.
Implementation Restrictions
Restrictions: you may use any standard C library functionality (but see the notes below). External libraries are not allowed unless permission is granted in advance. Your code must compile and run on your VM set up with Arch Linux as described in class – failure to do so will receive a grade of 0.
While there are several ways to retrieve the system information displayed by your project, you must retrieve the data from /proc only.
One of the major components of this assignment is reading and parsing text files. To read the files, you are required to use the read system call instead of the fancier C library functions like fgets, getline, *scanf, etc. You also shouldn’t use getpwuid, strsep, or strtok, and processing the text files using regular expressions is not allowed.
Rationale: we’re using read here to get familiar with how I/O works at a lower level. You will need to be able to understand read for subsequent assignments. As for strtok, it has several pitfalls (including not being reentrant or thread safe) that make it a bad choice. You need to do string splitting/tokenization manually.
Failure to follow these guidelines will result in severe deductions or a 0.
Grading and Submission
Check your code into your projects repository under p1.
To receive 70% credit:
- Implement the static information retrieval functions:
- Hostname, kernel version, number of CPUs, total memory
- Include support for alternate
procfslocations (-pflag) so we can test your implementation - Include a Makefile that supports at least the following targets:
- compile, install, clean, memcheck
- Write a
README.mdfile for your project that explains how it functions. This should be something you could show during a job interview.
To receive 80% credit:
- Complete all previous requirements
- Implement the load average and uptime displays
- Implement a live-updating text UI that refreshes based on the
-iinterval flag discussed above and the-o“one-shot” mode that only refreshes once and then exits.
To receive 85% credit:
- Complete all previous requirements
- Implement the live-updating memory output and test it with
stress
To receive 95% credit:
- Complete all previous requirements
- Implement the live-updating CPU output and test it with
stress
To receive full credit for this lab:
- Complete all previous requirements
- Implement your extra feature (remember that you must get it approved first)
Code Review
Your grade will also include a code review. During the code review we will check:
- Code quality and stylistic consistency
- Code reuse and abstraction. You should design helper functions that handle repetitive portions of your code, and they should ideally be designed so they can be used in future projects.
- Functions, structs, etc. have documentation where appropriate
- No dead, leftover, or unnecessary code.
You will also be asked to explain 1-3 parts of your implementation. You should be able to describe high-level design aspects and the challenges you faced implementing the features.